Key Findings |
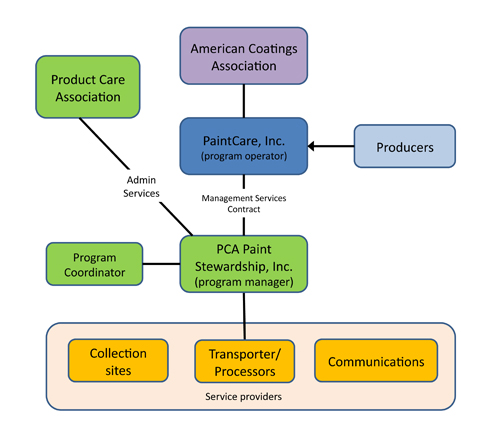
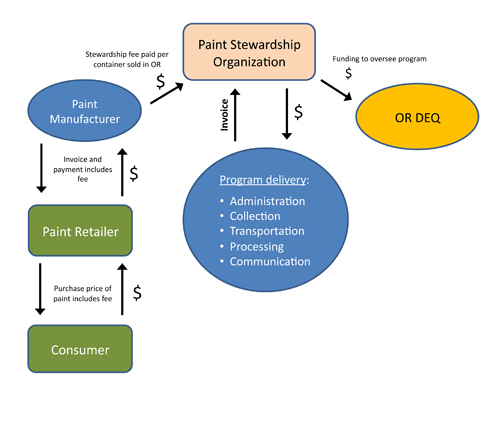
Program Organizational Chart
|
| |
 |
| |
For more information, read the GSU Report (page 5). |
| |
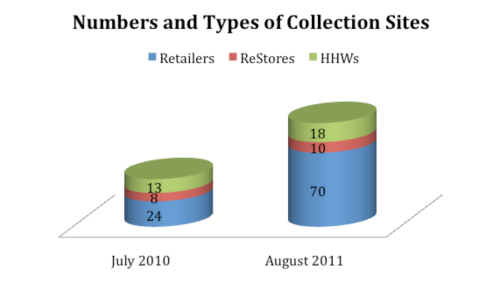
Infrastructure |
| |
- PaintCare’s strategy to set-up the collection infrastructure was to:
- Incorporate pre-program collection infrastructure (i.e., HHW facilities).
- Reach out to paint and independent hardware retailers to fill gaps in underserved areas.
- Send a letter to retailers of paint and decorator trade association list informing them of the program and an opportunity to be a collection site.
- Conduct web search and review yellow pages to reach out to additional paint retailers in gap areas.
- Metro, PSC, and Amazon Environmental are the service providers for processing of latex paint.
- Metro collects recyclable paint from its locations and accepts recyclable latex collected from the remainder of the state from PCS’s consolidation center. This paint is made into new recycled content paint, then sold or distributed.
- Non-recyclable latex paint collected by Metro is disposed of by biodegradation at Columbia Ridge Landfill in Arlington, OR. Through a research permit the paint is mixed with wastewater and pumped into the landfill to improve degradation of wastes and recovery of landfill gas.
- Non-recyclable latex paint collected and consolidated by PSC is processed into recycled content paint, PWP (a biomass fuel product) and PLP (an alternative raw material for cement manufacture) by Amazon environmental.
|
| |
 |
| |
 |
| |
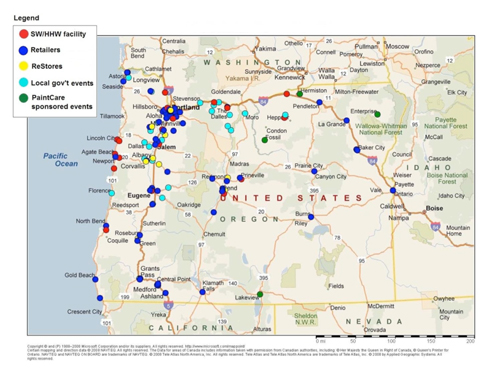
| Locations of Collection Sites in August 2011 (image taken from PaintCare Annual Report - Figure 6) |
| |
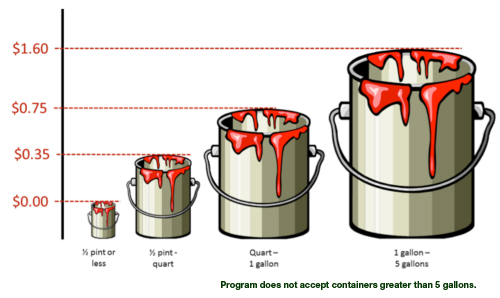
Assessment Fee |
| |
Container Volume |
Fee Assessment |
| ½ pint container or less |
$0.00 |
| > 1/2 pint to 1 quart container |
$0.35 |
| > 1 quart to 1 gallon container |
$0.75 |
| > 1 gallon to 5 gallon container |
$1.60 |
| Source: PaintCare Annual Report 2011, p.27 |
|
| |
 |
| |
- PaintCare’s budget and fee were developed based on the estimated sales of architectural paint in Oregon, estimated proportions of leftover paint available for collection, and volume and cost data from the Metro program and Oregon DEQ (non-metro areas). GSU Report (Table of Budget Summary, page 17)
- The following graphic depicts how the assessment flows between different actors in the system.
|
| |
 |
| |
- Despite projecting a deficit for the first year in the program plan and lower than estimated sales of paint, the fee assessment resulted in a surplus of $259,911 due to lower expenses. This surplus was not considered large enough to reduce assessment costs and will be carried over to year 2 and used for program costs PaintCare Annual Report (page 27).
- In 2011 11% of OR paint purchasers were aware of the fee.
- Legislation gave retailers the option to show the fee on the receipt. PaintCare reports that some do and some do not. Reprogramming how receipts are generated in a store’s computing system is a challenge for some retailers.
|
| |
|
| |
| |